PROBLEM
Plants were generally healthy but conditions were leaving photosynthetic
activity on the table during peak sun hours. Day temperatures ran high (~35 °C average) and humidity sat low (~45%) — far from the band the crop responded best to. No screening strategy in place between 10:00 and 14:00 when solar load peaked.
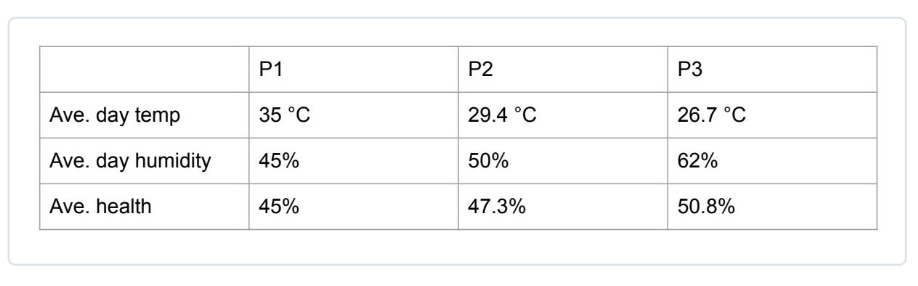
Day temperature, humidity and plant health across phases P1, P2 and P3
— verbatim from the EcoSense dashboard.
ECOSENSE INTERVENTION
- Continuously tracked plant health, air temperature and humidity across the facility.
- Recommended a staged screening intervention: P2 — 50 % screening 10:00–14:00 above 500 W/m²; then P3 — 50 % 10:00–12:00 and 60 % 12:00–14:30 above 500 W/m².
- Monitored health response after each phase change to validate the direction of travel.
RESULTS
Average day temperature: 35 °C → 29.4 °C → 26.7 °C across P1, P2 and P3.
Average day humidity: 45 % → 50 % → 62 %. Average plant health: 45 % → 47.3 % → 50.8 %. Continuous monitoring also detected a separate health drop in weeks 23–24 that correlated directly with a yield drop in the same period —
flagging stress earlier than weekly crop checks would.
RELEVANCE TO YOUR OPERATION
The same screening-and-photoperiod tuning logic applies to any high-wire tomato operation working with peak-sun stress. EcoSense quantifies the response so the screening recipe is dialed in by data, not by feel.